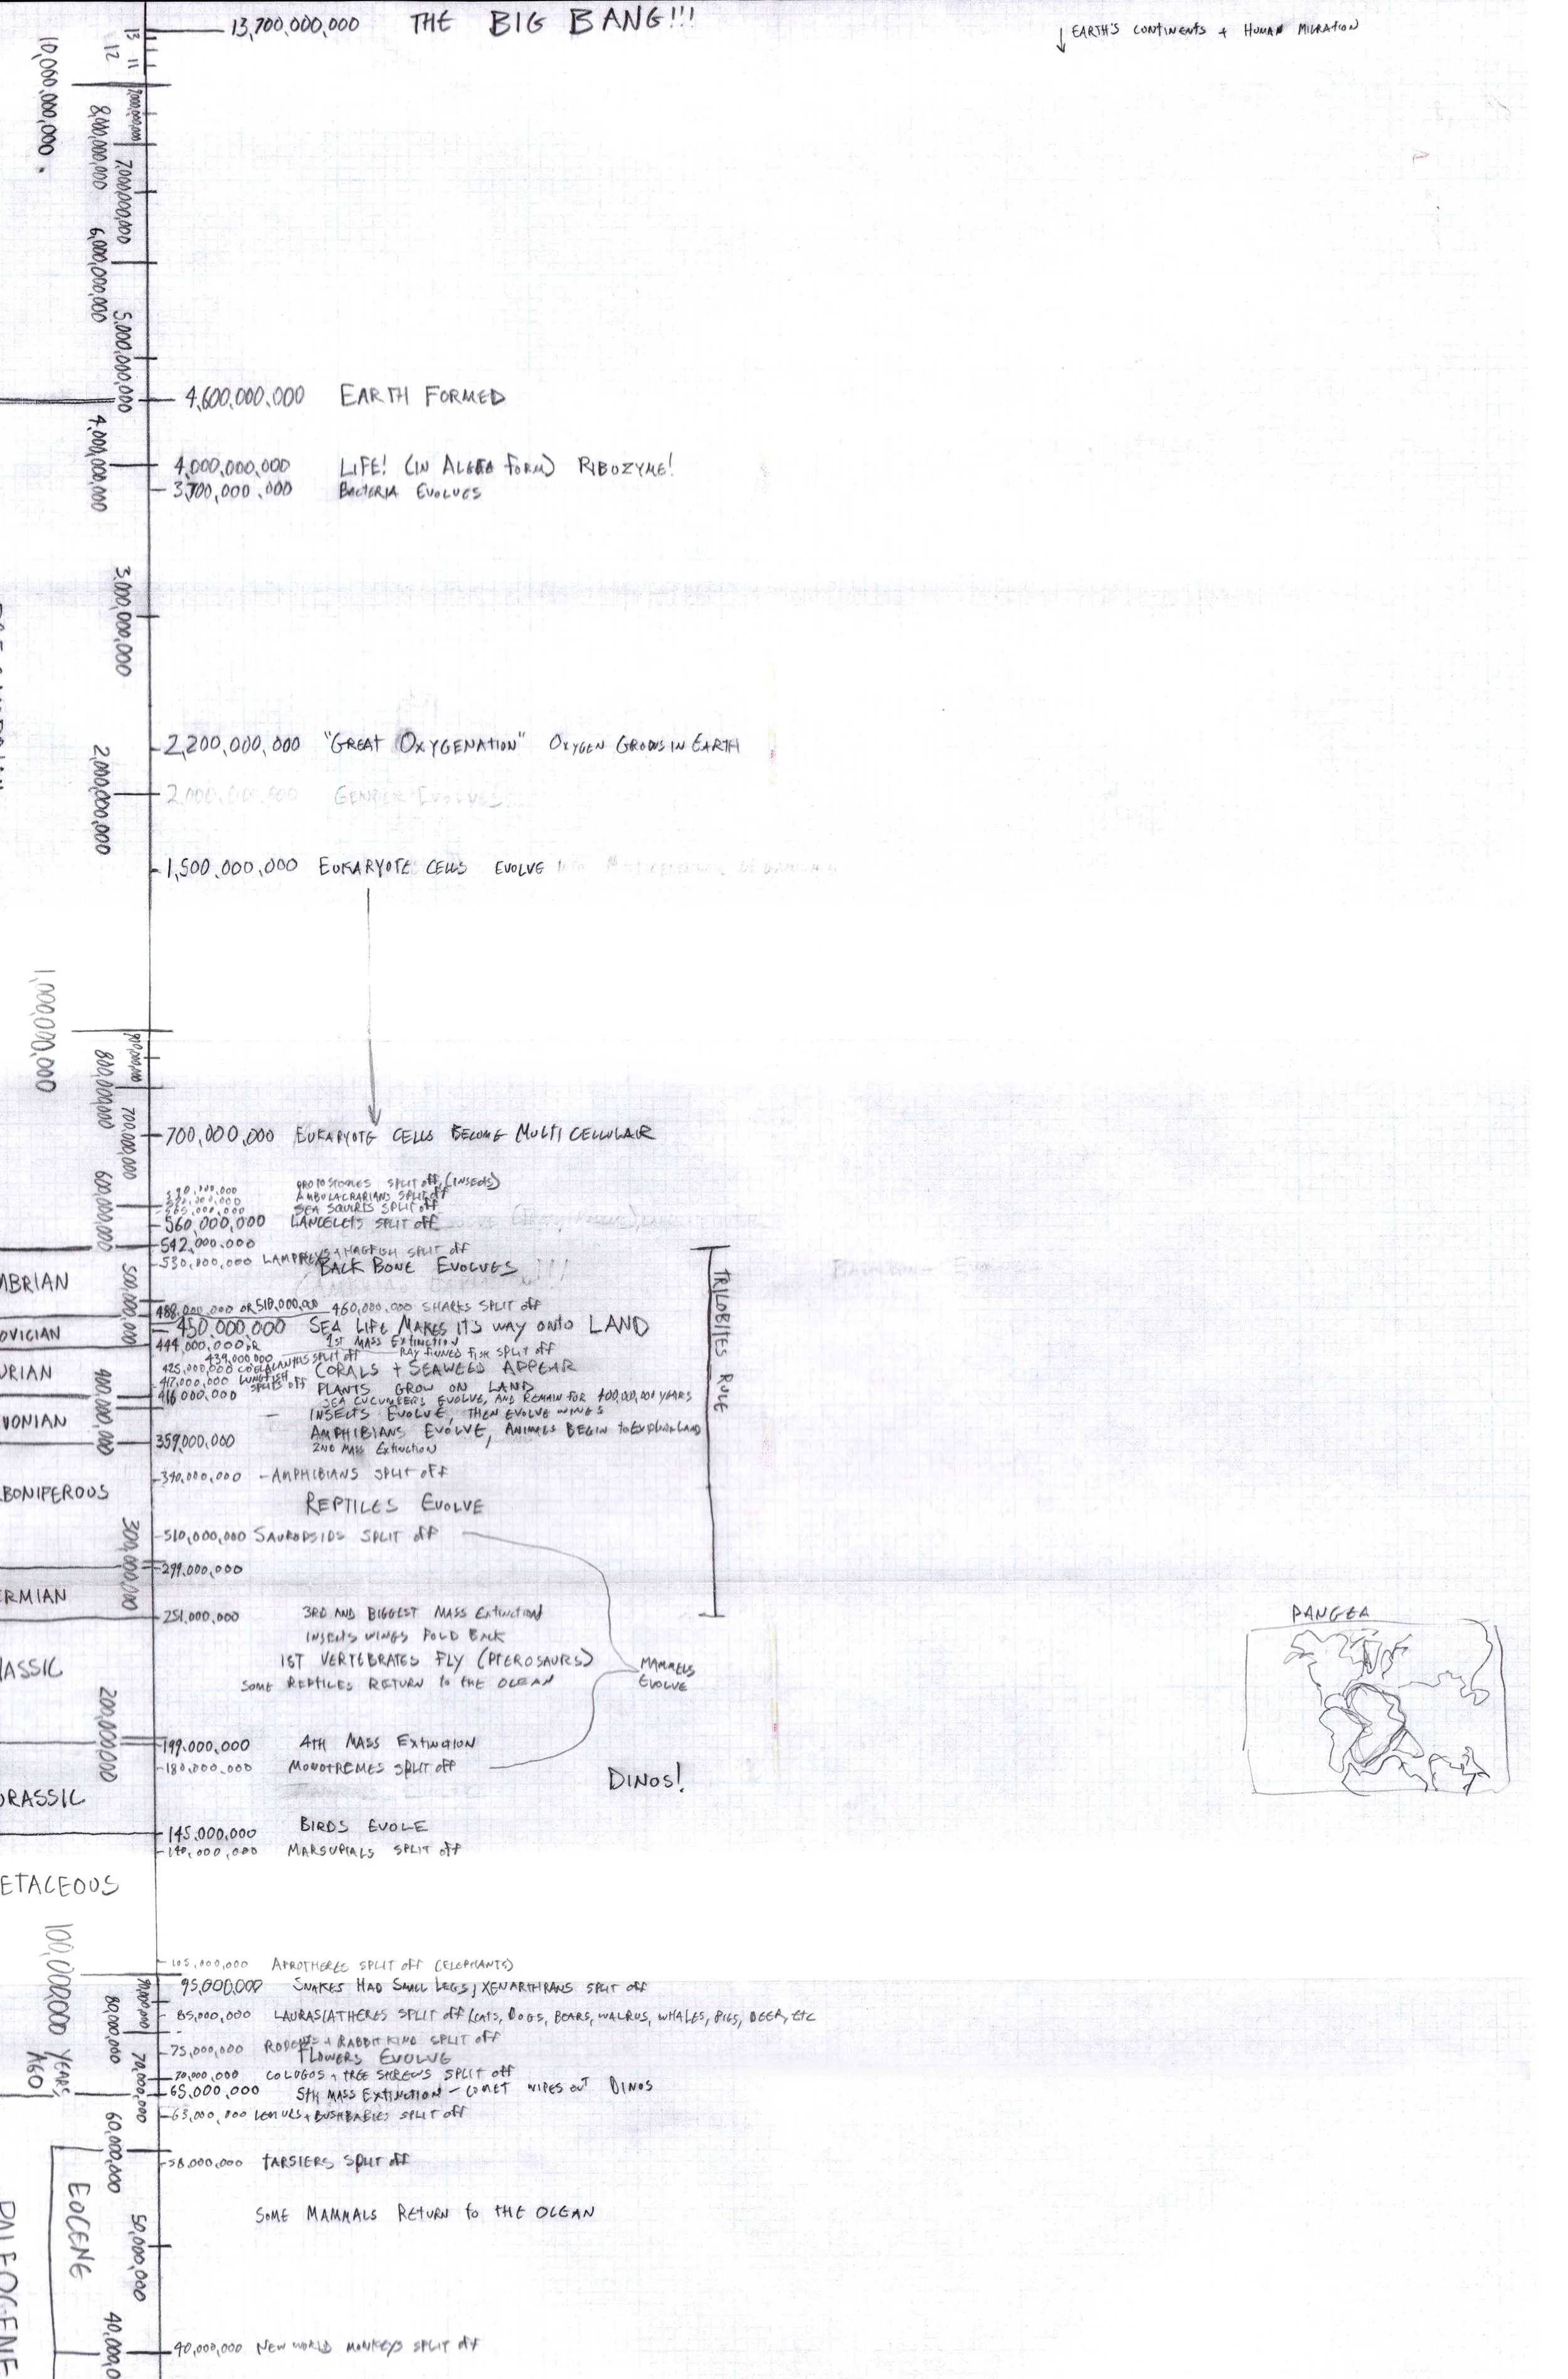
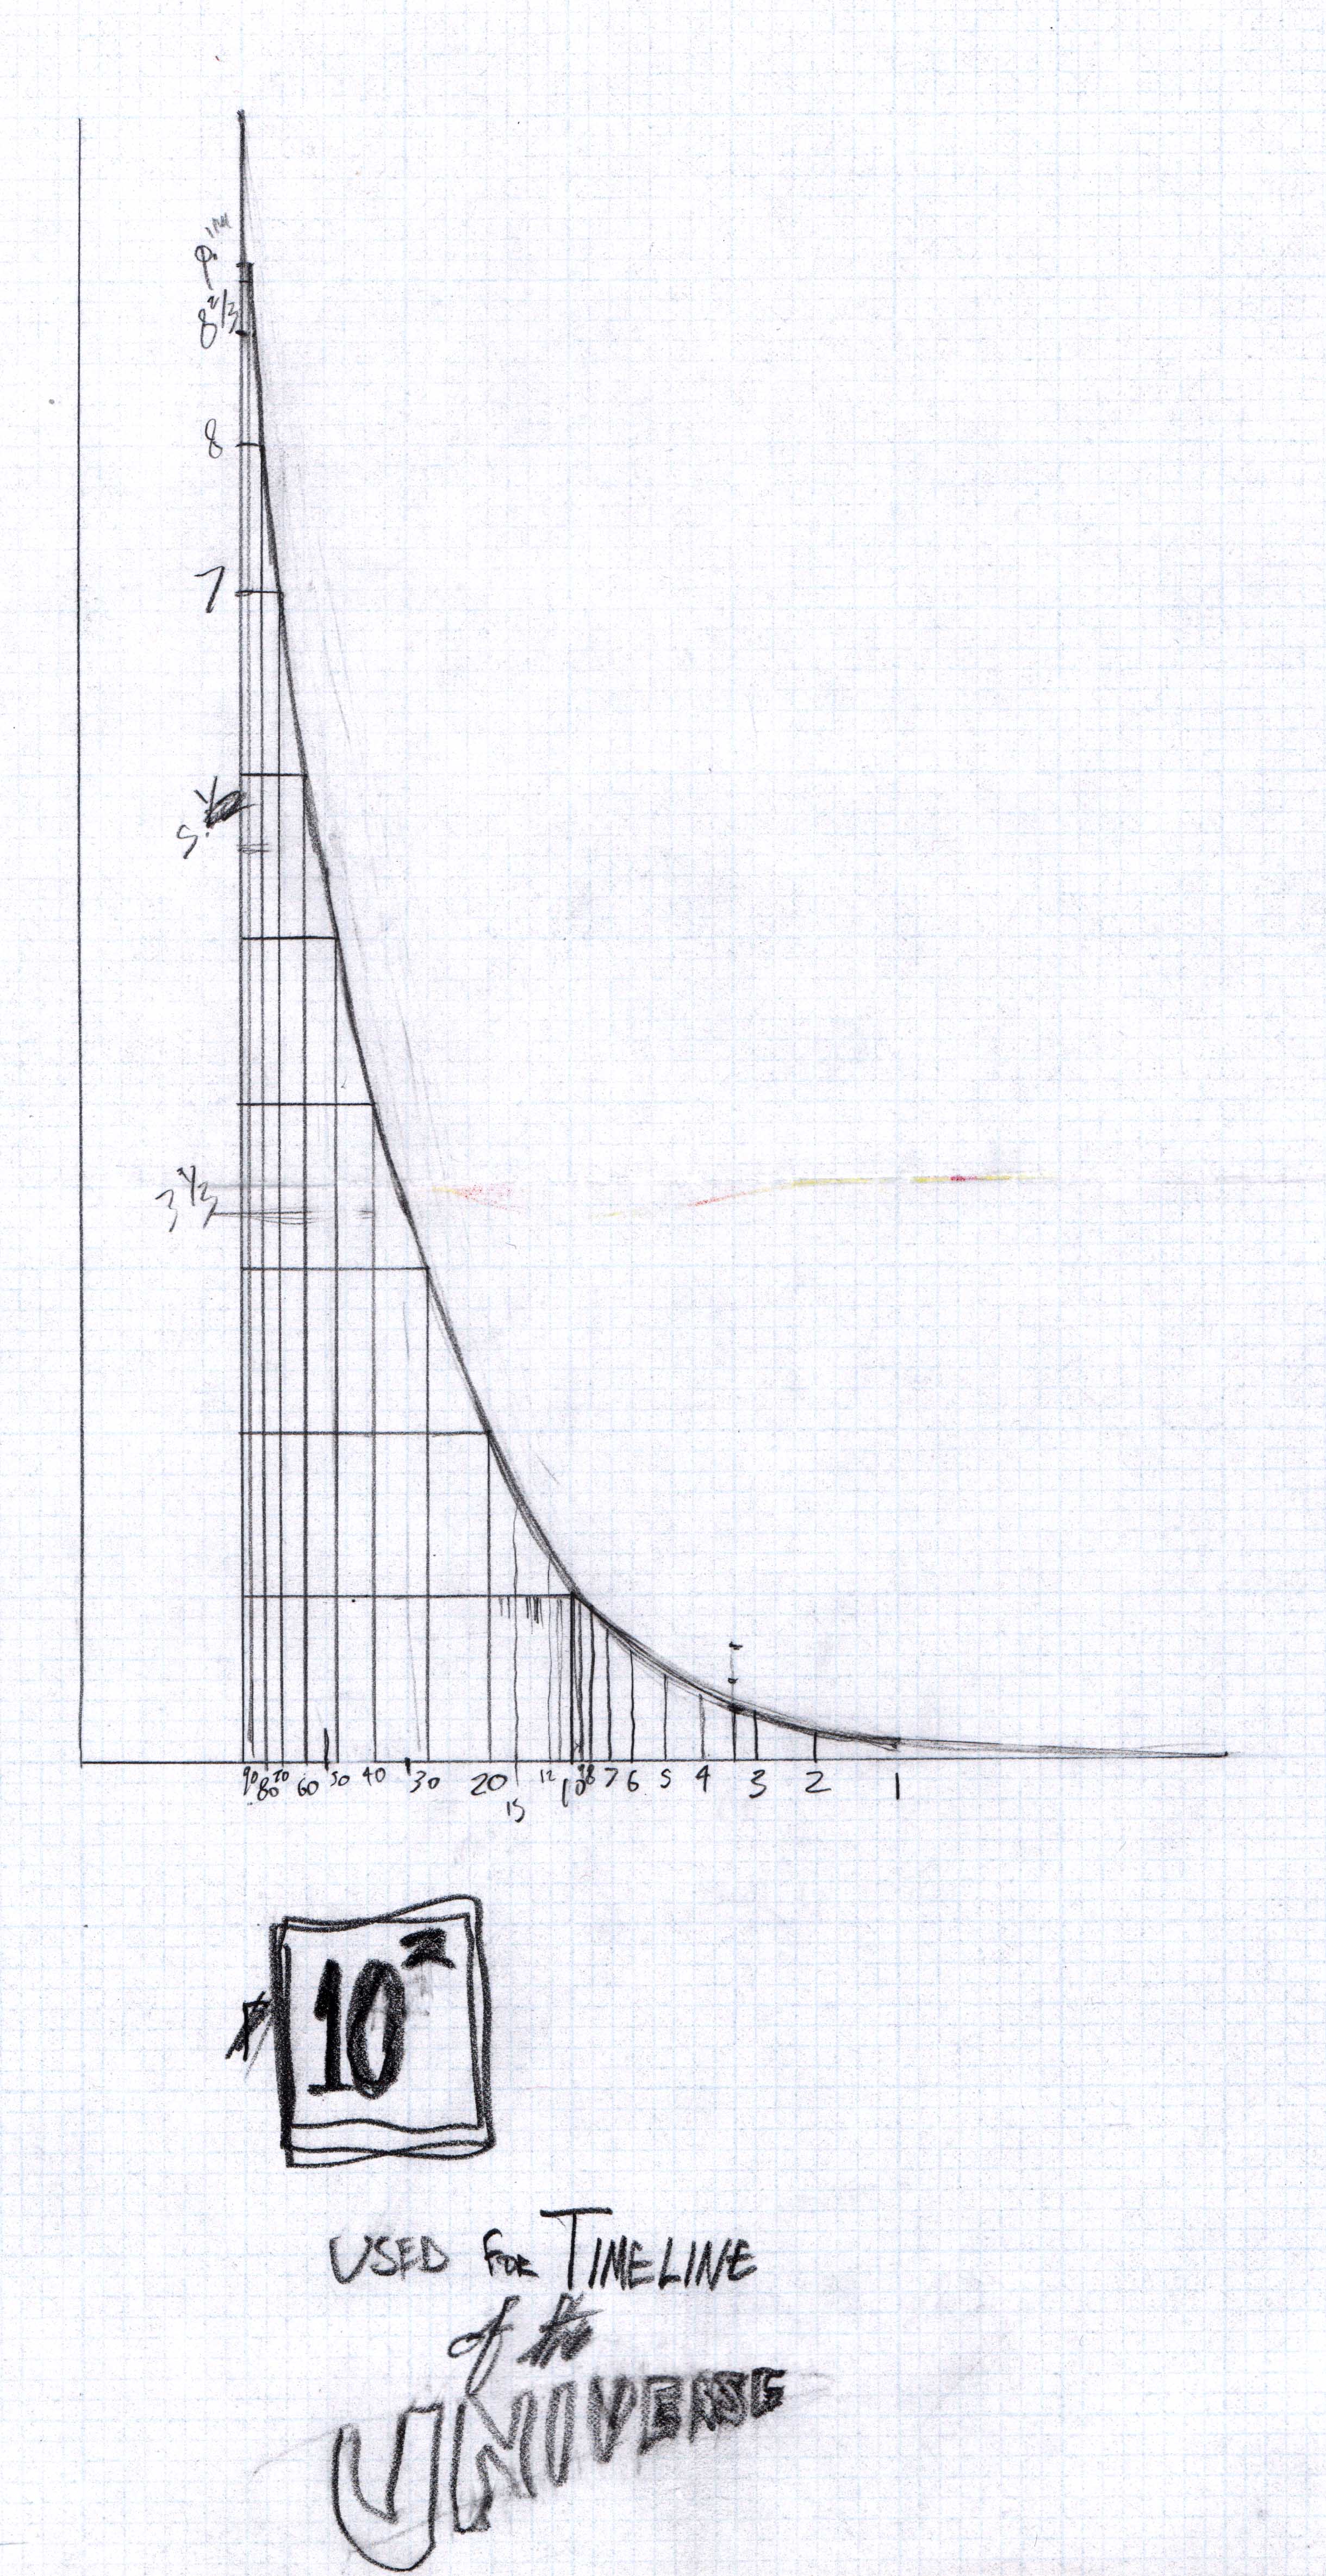
I’m a visual person. I see time as a shape. How close were events in history? Gimme a ruler. But with the bulk of human history happening in the last few thousand years (out of 13,700,000,000), how do you represent that timetable accurately? With the power on 10!
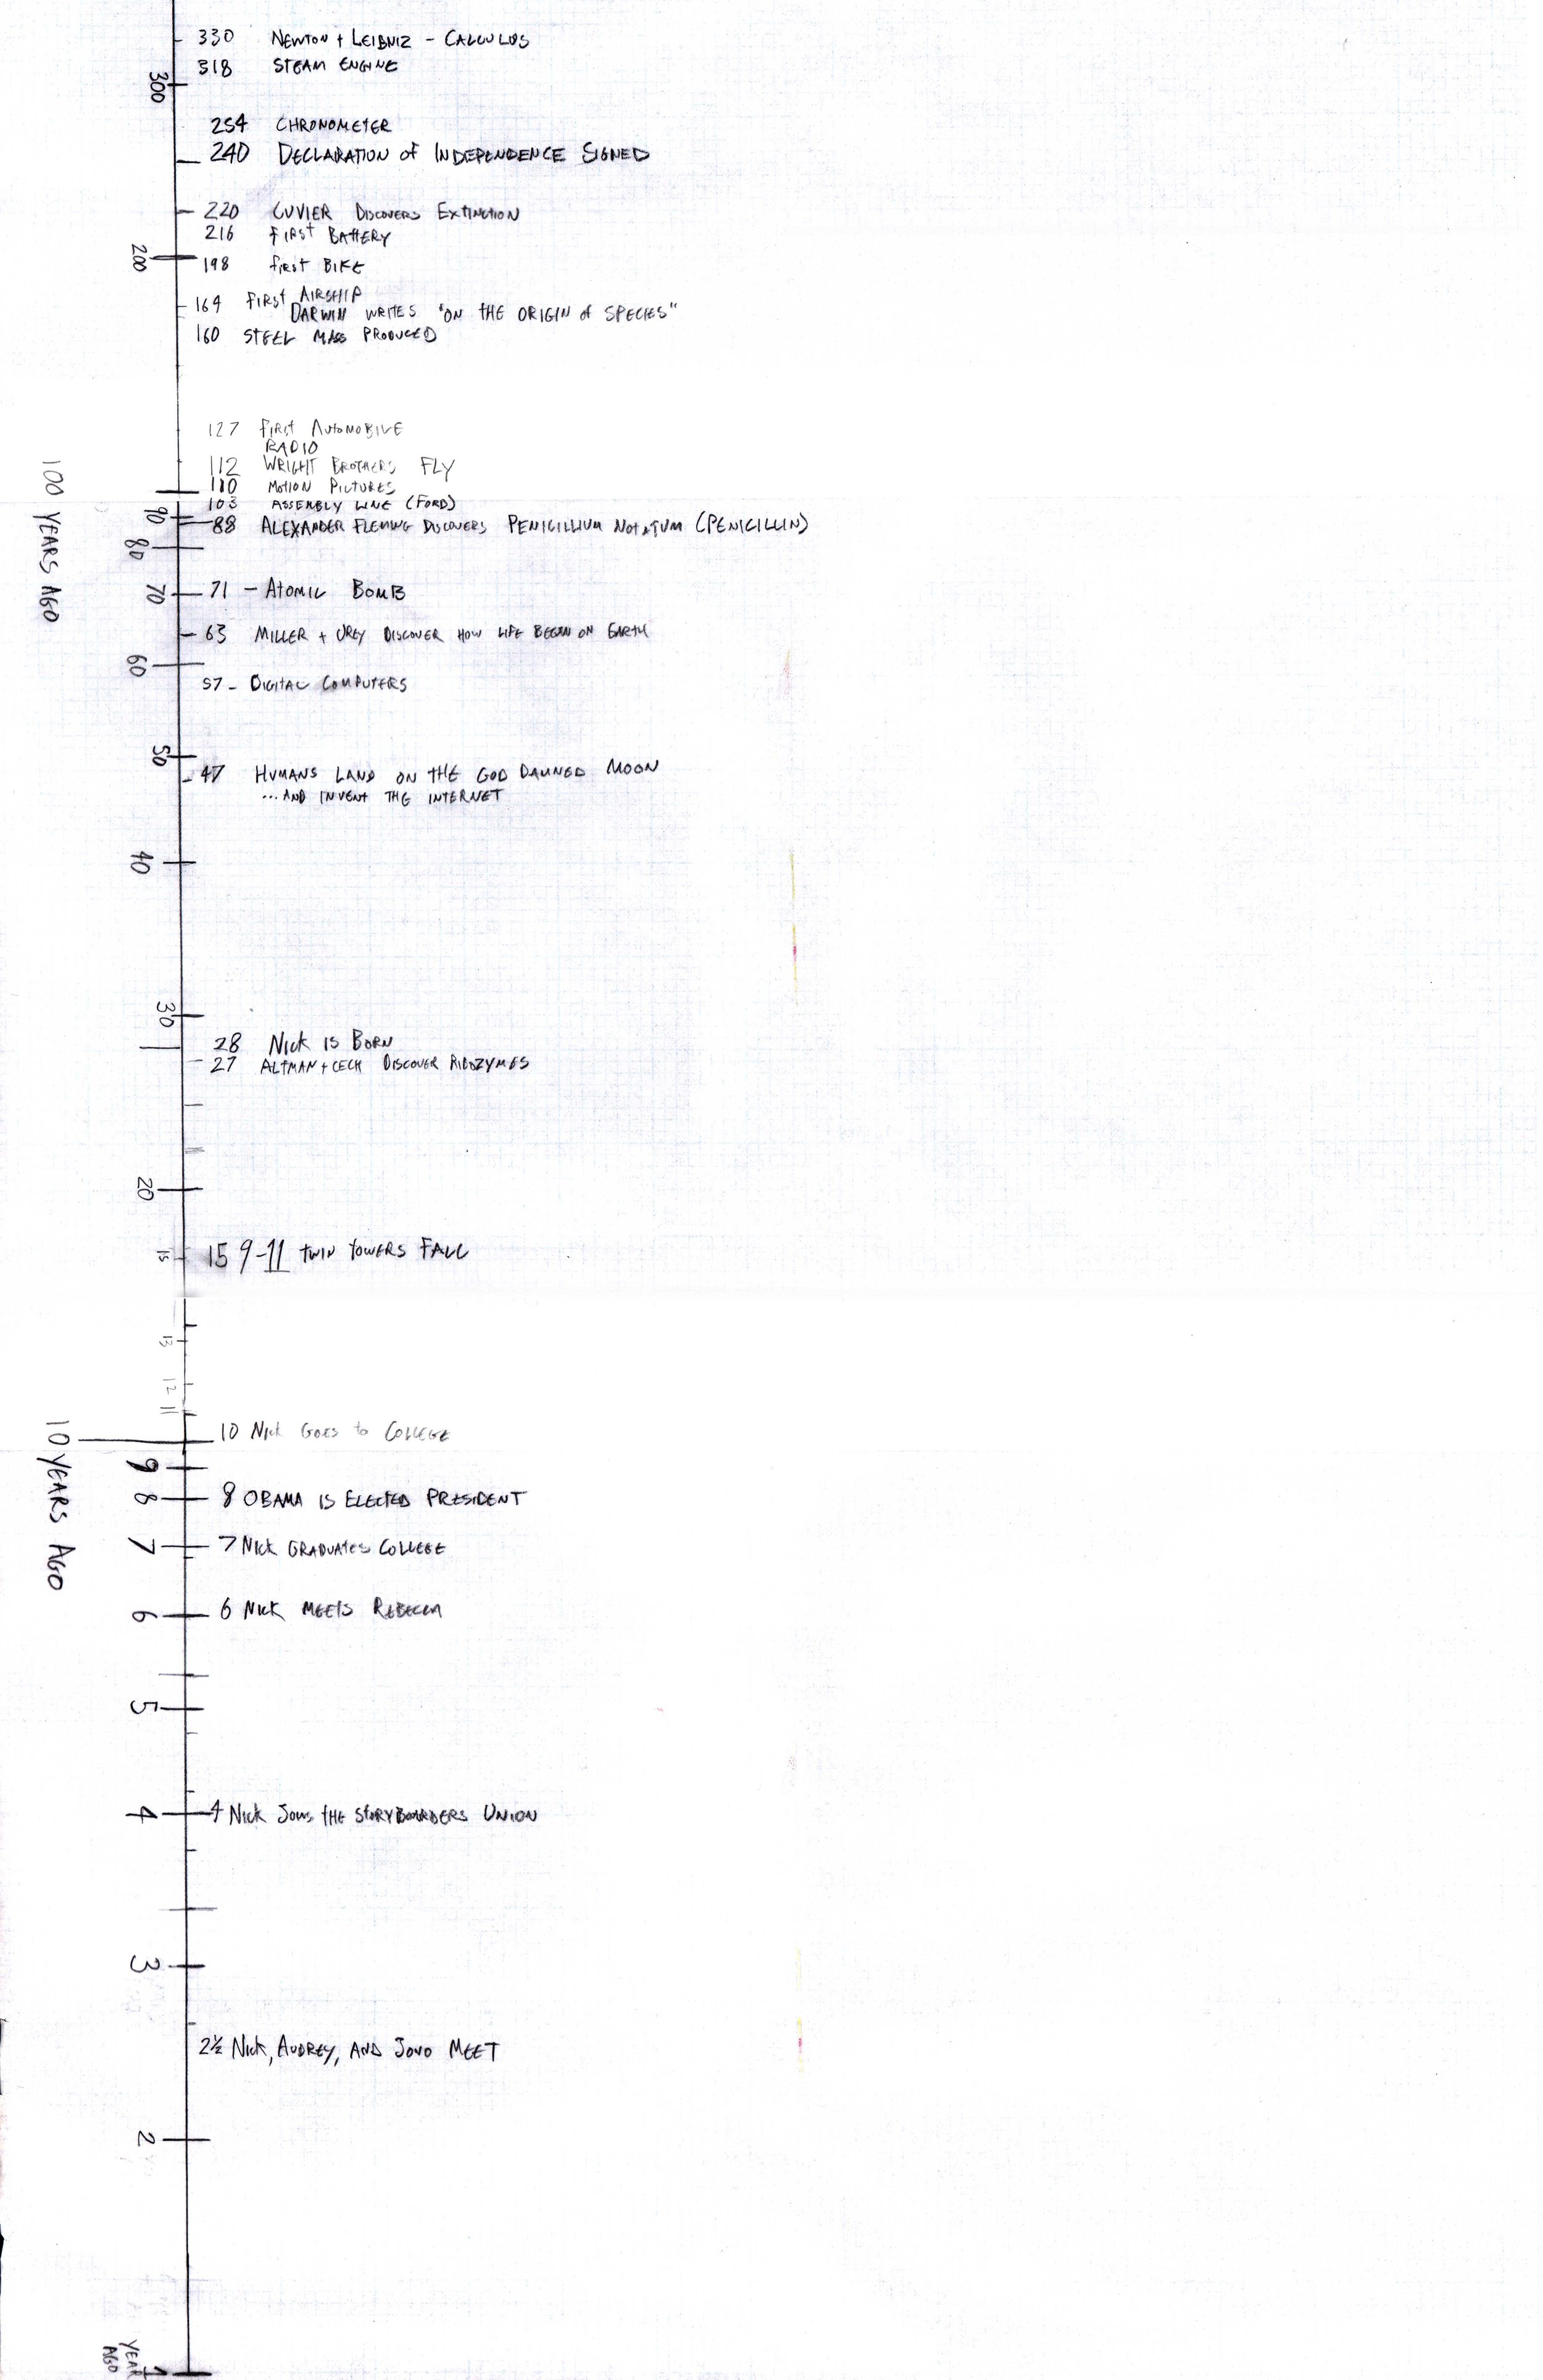
Note: This was made in 2016. Jono and Audrey are nerdy friends who dug this idea.